Better than I expected! Well, that covers that. See you next month, everyone.
Well, I have to talk a little more. My blog set a new readership record in April, topping — finally — the November 2015 spike when The AV Club noticed I wrote so much about how nothing was happening in Apartment 3-G. This can almost be explained by one thing: Easter. Particularly, Easter egg dying. I had taken pictures of what Paas-brand Easter egg dye tablets looked like, and what color they actually made eggs, and put that up on the web. And people were looking for exactly that. That page alone drew 1,057 views in April. This was even more than the home page for this blog, ordinarily the actual most-viewed page, drew. I figured that this would be a much-referred-to web site. I did not expect it to be that viewed.
Take away the 1,057 page views caused by the Paas corporation, though? And then … I … still have a record month for me. November 2015 saw 4,528 page views. April 2020 had 5,606 page views. That’s a gap of just more than 1,057 page views. It’s quite the spike. Some of that is probably spilloer from Paas-tablet-readers. But otherwise? Who’s reading and why? That’s what I look for here.
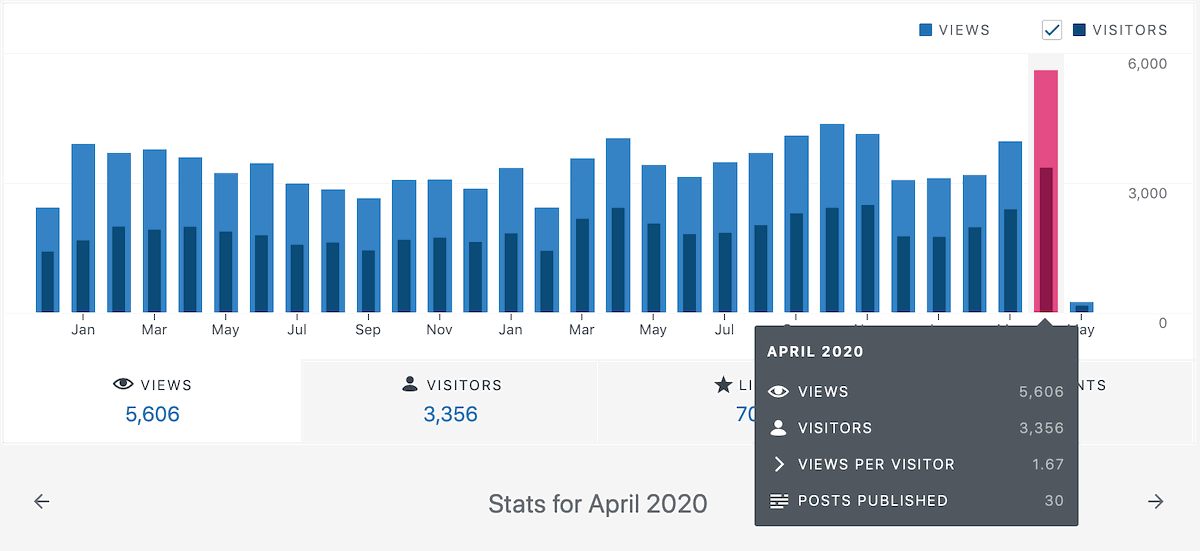
So, yeah, the numbers look good, if we take more to mean good. 5,606 page views, way above the twelve-month running average of 3,638.5. Even discounting the Paas page, 4,549 page views would be a new record. There were 3,356 unique visitors, again way above the running average of 2,101.6. The down beat was that there were only 70 things given likes in all April, below he average of 123.1. Comments, though? There were 48 of them, way above the average of 16.6, and my best commenting month since January 2019.
Per-post, the figures are just about the same: 186.9 views per posting, above the average of 119.3. 111.9 visitors per posting, above the 69.0 running average. 2.3 likes per posting, below the average 4.0. 1.6 comments per posting, way above the 0.5 average. I’d like to think this sort of viewing and commenting is a trend that’ll continue, but I understand how much of it is juiced by Paas.
So what was popular? Paas tablets and what else? The top posts in April were:
As you see, what people really want to know from me is why comic strips look weird today. Mallard Fillmore, that’s easy to say. Loren Fishman has taken over as “guest cartoonist” until Bruce Tinsley returns. Don’t care. I’m not reading Mallard Fillmore unless I hear it’s great from multiple independent lines of trusted references.
April’s most popular thing I wrote in April was Emotional Drafting, one of my long-form essays. And one focused on a little bit of coping with Covid-19, in an extremely small and me way. The most popular statistics piece was Where Comic Strips Are Set. I mention because I hope linking to it will make it easier for people to find. Legitimately: Wikipedia reports Chic Young, the creator of Blondie, asserted in 1946 that the strip was set near Joplin, Missouri.
514 posts got at least one viewing in April, up from 484 in March. 323 got more than one view, up from 302 in March. 76 of them got at least ten views, which is basically tied with March’s 75.
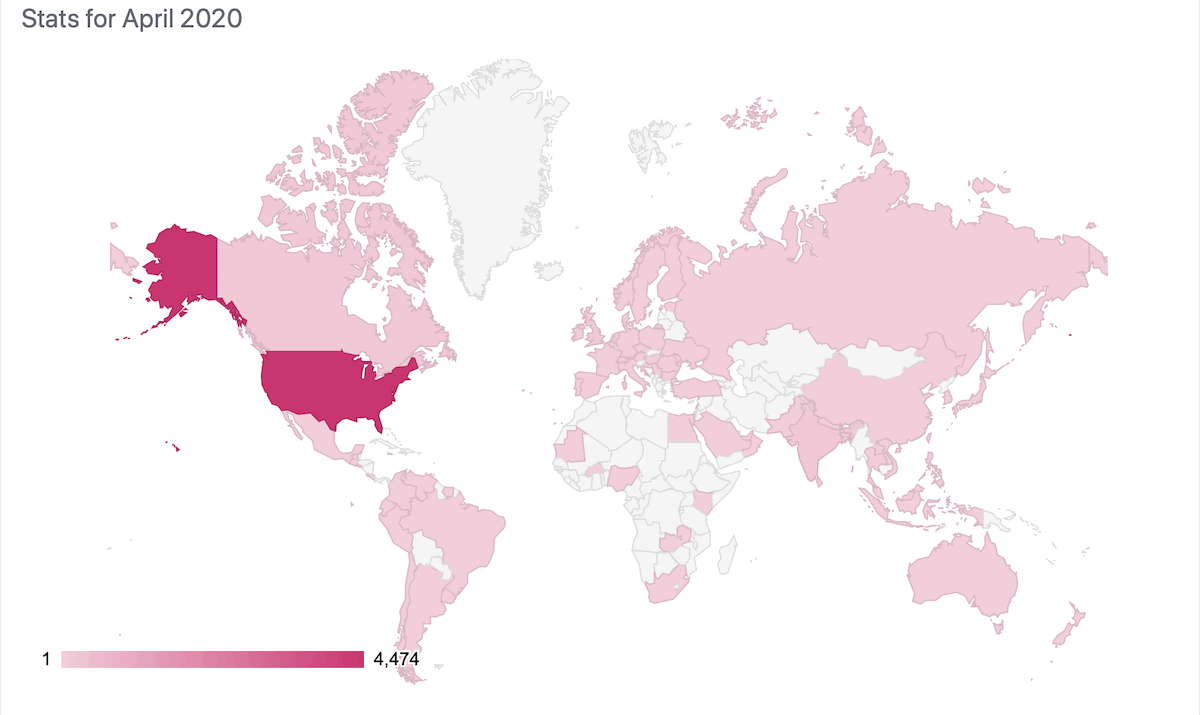
78 countries sent me any viewers at all in April. That’s right about March’s 73 and February’s 71. 19 of these were single-view contries, basically the same as March’s 20 and February’s 18. And here’s what they were:
| Country | Readers |
|---|---|
| United States | 4,474 |
| India | 191 |
| Canada | 149 |
| United Kingdom | 125 |
| Australia | 90 |
| Germany | 57 |
| Italy | 42 |
| Sweden | 33 |
| Mexico | 28 |
| South Africa | 26 |
| Philippines | 24 |
| Brazil | 21 |
| Colombia | 21 |
| France | 19 |
| Netherlands | 18 |
| Ireland | 16 |
| New Zealand | 15 |
| Kenya | 14 |
| Spain | 14 |
| Finland | 13 |
| Pakistan | 12 |
| China | 10 |
| Indonesia | 10 |
| Norway | 10 |
| Peru | 10 |
| Russia | 10 |
| Singapore | 9 |
| Belgium | 8 |
| Portugal | 8 |
| Turkey | 8 |
| United Arab Emirates | 8 |
| El Salvador | 7 |
| Malaysia | 6 |
| Poland | 6 |
| Switzerland | 6 |
| Ecuador | 5 |
| Hungary | 5 |
| Thailand | 5 |
| Argentina | 4 |
| Romania | 4 |
| Taiwan | 4 |
| Bulgaria | 3 |
| Chile | 3 |
| Israel | 3 |
| Laos | 3 |
| Moldova | 3 |
| Nigeria | 3 |
| American Samoa | 2 |
| Bahrain | 2 |
| Costa Rica | 2 |
| Czech Republic | 2 |
| Denmark | 2 |
| Estonia | 2 |
| Hong Kong SAR China | 2 |
| Jamaica | 2 |
| Serbia | 2 |
| Sri Lanka | 2 |
| Ukraine | 2 |
| Zambia | 2 |
| Austria | 1 |
| Bangladesh | 1 (*) |
| Burkina Faso | 1 |
| Croatia | 1 |
| Egypt | 1 (*) |
| European Union | 1 |
| Guadeloupe | 1 |
| Guatemala | 1 |
| Japan | 1 |
| Lebanon | 1 (**) |
| Mauritania | 1 |
| Nepal | 1 |
| Oman | 1 |
| Saudi Arabia | 1 |
| South Korea | 1 |
| Suriname | 1 |
| Uruguay | 1 |
| Venezuela | 1 |
| Vietnam | 1 |
Bangladesh and Egypt wee single-view countries in March too. Lebanon is on a three-month streak of single views. Also … really, wow? Only one page view from Japan? I know I write a painfully parochial blog, but Japan also has like 750 million people who can read English in it. I’d think just by accident it would have to out-draw, like, Suriname. Which again is nothing against Suriname; I just think of what I write and totally get nobody in Suriname caring.
And what do I write? Well, late Thursday, Eastern Time, I post a long-form essay, trying to get to around 700 words. Saturday nights I post a Statistics Saturday thing, some joke that can be a list or a pie chart and that doesn’t save as much time to write as you’d think. And then, at least this cycle, I’m trying out putting my What’s Going On In Story Strips posts on Tuesdays. My plan for the next month is:
- Mark Schultz and Thomas Yeates’s Prince Valiant (12th of May)
- Joe Staton, Mike Curtis, Shelley Pleger, and Shane Fisher’s Dick Tracy (19th of May)
- Jim Scancarelli’s Gasoline Alley (26th of May)
- James Allen’s Mark Trail (2nd of June)
This is always subject to change in the event of fast-breaking story comic news or my deciding I want to do something different.
As WordPress counts things I posted 19,010 words in April, for an average post length of 633.7 words. This is quite up from March’s 17,019 words and 549 words per posting. So, yes, I’m getting longwinded again. For the year through the start of May I had published 67,888 words in 119 postings. This averages 571 words per posting.
The start of May saw me posting 2,646 things, viewed a total of 167,135 times by 93,757 unique visitors.
If reading a bunch of numbers about posts has encouraged you to read me regularly, all right, that’s a valid choice. You can follow this blog in your WordPress reader by clicking the “Follow Another Blog, Meanwhile” button. Or you can add my RSS feed to whatever reader you use. If you don’t have an RSS reader, sign up for a free account with Dreamwidth or Livejournal. Their Friends pages let you add RSS feeds from anywhere. And you can catch announcements of these posts on my no-longer-inaccessible Twitter account, @nebusj. Thank you for reading, if that is what you’re doing here. Take care, please.


