Statistics April: In Which People Look To Me For Something Not Comic-Strip-Related


You know what data WordPress never gives you about your readership? It’s what search terms brought readers. I suppose they figure to writers that data, unaware that while I enjoy this blog I could also do other stuff with my time. Still, what gets me wondering about search terms is that my most popular posting from April was not a comic strip update. In fact, of the seven most popular pieces — there was a three-way tie for fifth — four of them had nothing to do with comics. Here’s the most popular April posts:

Right? Isn’t that weird? The most popular Statistics Saturday post was one I expected to do well, Statistics Saturday: Things You Should Know For The Solar Eclipse. This was another Statistics Saturday post that could as easily have been an essay, if I were still in the business of writing essays.

Bar chart of two and a half years' worth of monthly readership figures. After a peak in April 2021 the months hovering around 4500 views per month, without strong direction one way or another, until a new peak emerged in April 2022. A smaller peak reappeared in August 2022 and September 2022. After a sudden drop in May 2023 it grew several months in a row before dropping in September 2023. It jumps to a new peak in October and November 2023, then dips and rises again, rising and falling from December 2023 through April 2024.
Also why has my readership taken this turn where it goes way up and then way down in alternate months? Why not a gradual trend one way or another?

Despite the popularity of me grumbling about a spam call and me being facetious about solar eclipses, this was a down month for my readership. I suppose people weren’t looking as much for Easter egg dye color information after Easter was done and all. There were 5,253 page views in April, well below the twelve-month running mean of 5,743.7 and a bit below the running median of 5,483.5. The unique visitor count was also down, with 3,019 visiting in April. The running mean had 3,334.4 visitors in a month, and the median 3,084.5.

In terms of interactions, though, this was a more normal month. There were 122 likes given to posts over April, noticeably above the running mean of 96.8 and the running median of 98. Huh. And comments were almost exactly on average, with 54 given or received, compared to a mean of 56.3 and median of 56.5.

As usual, I have plans for the month ahead. Also as usual, the plans only go so far as talking about comic strips. In particular, my expectation is that I’ll be posting something about these comics more or less on these days:

And I will say, Comics Kingdom’s new thing where subscribers can look at a strip up to a week ahead of publication? That ought to make it a lot easier to get ahead of deadline on these essays. It doesn’t, but it so ought to.

Mercator-style map of the world, with the United States in dark red and most of the New World, western Europe, South and Pacific Rim Asia, Australia, and New Zealand in a more uniform pink. China and most of Africa are blank.
Oh so now can I mention that just this past month I learned that the Netherlands Antilles were dissolved fourteen years ago? I mean, the islands are still there, it’s just that they’re no longer politically organized as a constituent country of the Netherlands anymore. Two of them became their own constituent countries of the Netherlands and the others became part of the Kingdom of the Netherlands. This doesn’t seem to me like they’re getting much of anywhere but it’s not my place to organize Dutch rule of Caribbean people.

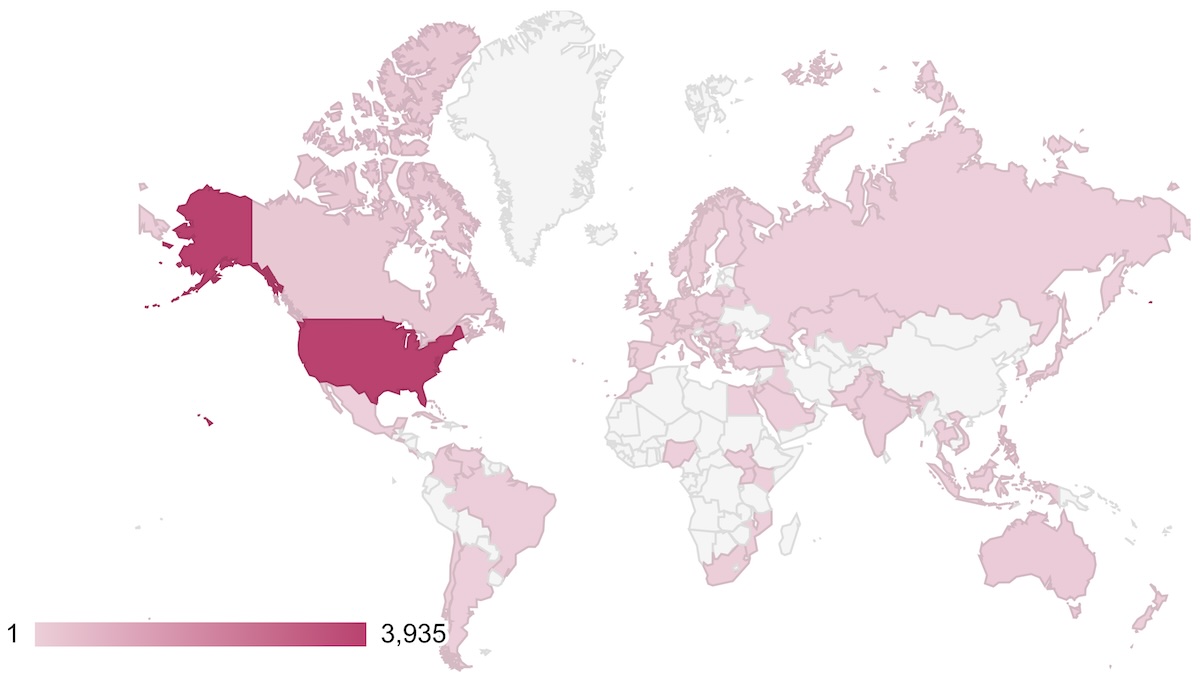
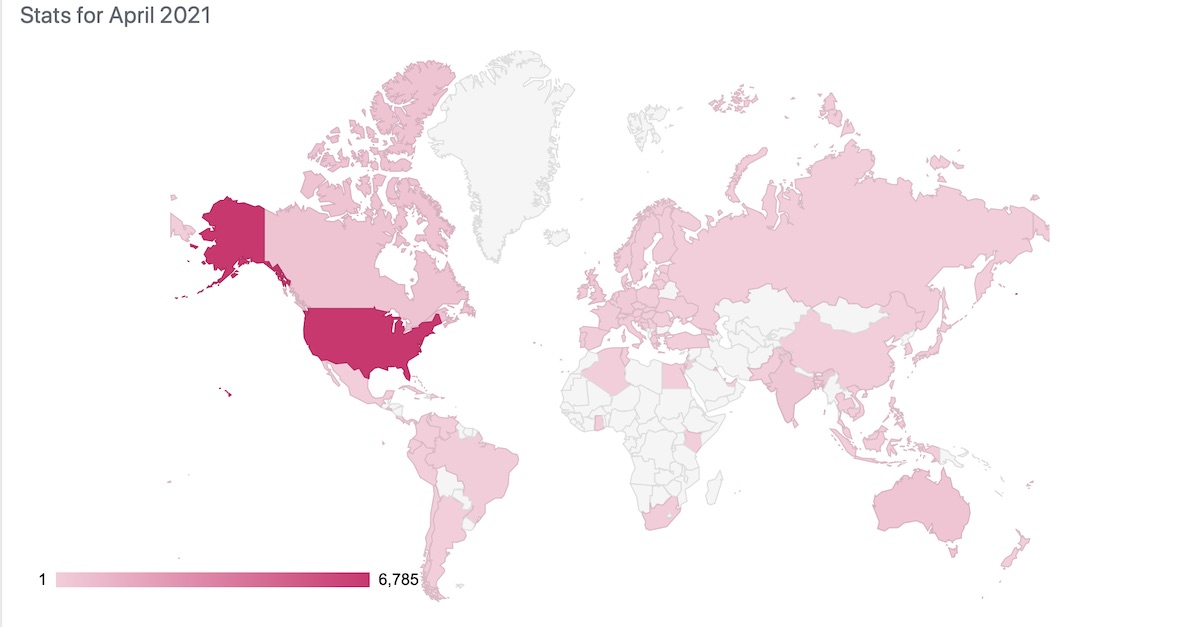
Back to countries. There were 91 countries sending me any readers at all, so even though the reading population was smaller it was better dispersed. 25 of them were single-reader countries, including a mysterious “Unknown Region” that I imagine reflects where Wilbur Weston was tossed off a cruise ship or something.

Country Readers
United States 3,935
Canada 210
United Kingdom 208
Philippines 177
Australia 97
India 73
Brazil 41
France 29
Ireland 27
Germany 26
Italy 26
South Africa 25
Sweden 25
Spain 24
Greece 22
Mexico 13
Singapore 12
Colombia 11
Netherlands 11
Thailand 11
European Union 10
Pakistan 10
Denmark 9
Japan 9
Norway 9
Russia 9
Saudi Arabia 9
Croatia 8
Indonesia 8
Czechia 7
South Korea 7
Turkey 7
Argentina 6
Portugal 6
Switzerland 6
Taiwan 6
Hong Kong SAR China 5
Israel 5
Luxembourg 5
New Zealand 5
United Arab Emirates 5
Bahamas 4
Chile 4
Kazakhstan 4
Malaysia 4
Poland 4
Romania 4
Serbia 4
Uganda 4
Austria 3
Belgium 3
Cuba 3
Egypt 3
Finland 3
Hungary 3
Kenya 3
Puerto Rico 3
Caribbean Netherlands 2
Costa Rica 2
Iraq 2
Mozambique 2
Nigeria 2
Palestinian Territories 2
Qatar 2
Slovakia 2
Vietnam 2
Åland Islands 1
Albania 1 (*)
Armenia 1
Belarus 1
Bulgaria 1
El Salvador 1 (**)
Faroe Islands 1
Grenada 1
Jamaica 1
Jordan 1
Kosovo 1
Lebanon 1
Lithuania 1
Macao SAR China 1
Maldives 1 (*)
Malta 1
Montenegro 1
Morocco 1
Nepal 1 (**)
South Sudan 1
St. Lucia 1
St. Vincent & Grenadines 1
Trinidad & Tobago 1
Unknown Region 1
Venezuela 1

El Salvador and Nepal have sent me a sole page view three months in a row. Albania and Maldives have sent a single view only two months in a row now. And that’s the single-view count for April. Remember, you can keep your country from being a single-view country just by hitting refresh on this page! I think. I’m not positive. You might want to click on a second or third page to be sure.

For the start of May, 2024, WordPress estimates that I’ve had about 428,747 page views here from 242,053 unique visitors. It also estimates that I published 13,920 words in April, which is surprising because that’s 24 words fewer than I did in March when I had all those short-format pairwise comparisons going. Still, the average length of a post dropped from 549 words in March to 528 words in April so the difference isn’t entirely that I had fewer days to go on like this.

If you’d like to see me going on like this most days, why not sign up as a regular reader? The surest way to get everything I post is to put my RSS feed into your RSS reader. If you don’t have an RSS reader, you probably do, it’s just not advertised as such. Next-best is to click the ‘Follow Another Blog, Meanwhile’ button up and to the right of this text on your page here; that should add it to your WordPress Reader. If you’d like the unedited and uncorrected pieces e-mailed to you, there’s a similar box where you can put in your e-mail address and get daily posts. I don’t do anything with your e-mail addresses besides send these posts, but it’s WordPress who gets your e-mail so I can’t promise what they do. Probably something horrible; you know how companies are. Sorry. On to the goofball stuff tomorrow.

Statistics April: Mostly, People See Me As A Source For Easter Egg Color News


I was tolerably well-liked, according to WordPress, back in April. A good chunk of that was Easter’s fault. I had a post several years ago explaining which Paas color tablet was which color. Paas helpfully makes all their tablets look about the same and has, or used to have, instructions to not put vinegar in one of them or else the egg will detonate. I used as a color reference Coke Zero cans, just in time for the Zero corporation to change their cans so it’s harder to tell the Zero from the Not-Zero cans. Life, you know?

But the big news is I got 5,357 page views in April, a slight increase from March. This total is actually below the twelve-month running mean leading up to April, though, which was 5,759.8 views per month. It’s also down a little from the twelve-month running median of 5,491.5. Unique visitors were a more happy number, if bigness is happiness. There were 3,091 visitors in April, above the running mean of 2,975.1 and running median of 2,905.

Bar chart of two and a half years' worth of monthly readership figures. After a peak in April 2021 the months hovering around 4500 views per month, without strong direction one way or another, until a new peak emerged in April 2022. A smaller peak reappeared in August 2022 and September 2022.
It’s hard not to feel like I could have just photocopied the last seven months’ worth of these reports.

Is that a sign of me being less liked this past month? No, but here’s two that are. I had 85 posts liked in April, well below the running mean of 141.3 and median of 137.5. And there were 56 comments over the month, below the mean of 73.3 and median of 80. This month, by the way, I resolved to answer comments within the day of my getting them, and I missed only (checks) 16 days. And this is somehow an improvement. Sociability is maybe not for me.

I mentioned the Paas tablet thing, which was by far the most popular post of mine in April. The most popular things I published in April, though, were:

I’m delighted that one of the MiSTing chapters finally cracked the top five. Meanwhile, my plan for the most popular of my projects is explaining what’s going on in …

So this should be a popular month comic-strip-wise.

Mercator-style map of the world, with the United States in dark red and most of the New World, western Europe, South and Pacific Rim Asia, Australia, and New Zealand in a more uniform pink.
I get that everyone in Ukraine has better things to do than read my nonsense, and agree with them. I’m surprised more of the world doesn’t.

There were 89 countries or things as good as countries sending me readers. Here’s who they were:

Country Readers
United States 4,115
India 172
Canada 132
Australia 88
United Kingdom 65
Brazil 63
Sweden 62
Spain 44
Italy 43
Germany 35
Japan 33
Mexico 33
Philippines 33
France 24
South Korea 22
Norway 21
New Zealand 20
Peru 17
Colombia 16
Netherlands 14
Finland 13
Switzerland 13
Indonesia 11
Saudi Arabia 11
European Union 10
Serbia 10
Singapore 10
Chile 9
Denmark 9
Hungary 9
Argentina 8
El Salvador 8
Malaysia 8
Austria 7
Czechia 7
Greece 7
Poland 7
South Africa 7
Belgium 6
Guatemala 6
Ireland 6
Kenya 6
Romania 6
Slovakia 6
Thailand 6
Turkey 6
Venezuela 5
Croatia 4
Israel 4
Nigeria 4
Portugal 4
United Arab Emirates 4
Costa Rica 3
Dominican Republic 3
Hong Kong SAR China 3
Pakistan 3
Russia 3
Slovenia 3
Taiwan 3
Yemen 3
Zimbabwe 3
Algeria 2
Bahamas 2
Bolivia 2
Ecuador 2
Estonia 2
Iraq 2
Mali 2
Malta 2
Morocco 2
Nicaragua 2
North Macedonia 2
Paraguay 2
Puerto Rico 2
Bahrain 1
Bangladesh 1
Barbados 1
French Polynesia 1
Ghana 1
Jamaica 1
Jersey 1
Kuwait 1
Mauritius 1
Nepal 1
Palestinian Territories 1
Panama 1
Sri Lanka 1
Togo 1
Trinidad & Tobago 1

And there may be fewer of these coming soon. WordPress announced they aren’t going to pay Elon Musk’s very funny idea of what it’s worth to post notices of articles on Twitter. So that, my last activity on Twitter, is gone … already? This week? As soon as someone at Twitter Headquarters remembers to turn it off? Who knows. Anyway the important thing is if you want to follow me regularly you need to do it by adding me to your WordPress reader, or to your RSS feed — https://nebushumor.wordpress.com/feed is its address — or sign up to get posts delivered by e-mail. Or occasionally wonder about Paas Easter egg tablet colors. Your choice.

Statistics April: What Does Everybody In Finland Want With Me?


It’s rare, but now and then this blog gets noticed. Usually it’s someone more popular than me linking to one of the images from my story strip recaps. So, turns out the 10th of April was one of those days. More mysterious is that it was someone in Finland doing it: that day I got 3,405 page views, a number that’s not far off my usual monthly total. This all came from 109 unique visitors, a figure that’s on the high side, but not outrageously so.

Also baffling is I can’t figure what everyone in Finland was looking at. I don’t mean literally everyone in Finland; Finland has a population of something like 5,500,000 people and 3,405 page views isn’t enough. Even if we suppose each page view was shared by a thousand people that’s still only about three-fifths of the population. But it’s still a lot all at once. It wasn’t any of my posts, so it must have been an image. But which one? So if you were one of the three-fifths of the Finland population who looked at something from my blog on this past 10th of April, could you leave a comment? I’m just curious what everyone was looking for.

The effect, anyway, is to give me a weird, distorted readership spike in time to replace the one in April 2021 that’s been distorting my twelve-month running averages. WordPress logged 8,350 page views around here, the second-greatest monthly total on my record. As you’d expect that’s well above the 5,167.9 running mean and 4,585 running median. If we take the Finland spike out, the month turns out to be close to the twelve-month running mean. WordPress figures there were 3,090 unique visitors, which is close to in line with the running mean of 3,028.5 and running median of 2,616.5 visitors.

Bar chart of two and a half years' worth of monthly readership figures. After a peak in April 2021 the months hovering around 4500 views per month, without strong direction one way or another, until a new peak emerged in April 2022.
I’d have liked to have got this screen grab at the moment when April 2022 ended, by WordPress’s clock, but I was doing things that involved not staring at a computer to watch for one particular second of the month. I know, I don’t know what I was thinking.

Likes and comments continue to dwindle out of existence. There were 133 likes given to things in April, and 42 comments. The mean for the twelve months leading up to April was 154.8 likes and 56.1 comments. The median was 154.5 likes and 53 comments.


So here’s the five most popular posts from April. Stuff from earlier than April was more popular than even the top position, yes. But you don’t need to know that around Easter people find my post about which Paas tablets are which color egg. I am annoyed that the color gnomon I used — the Coke Zero can — got redesigned, though.

This is the first time in ages I remember my most popular thing not being comic strip news. That’s sure to change for May, since my schedule for story comic recaps is:

I’m aware people really, really want to see The Phantom die already. Again, though, Man Who Cannot Die.


So even though Finland sent me like 3,250 more page views than usual in a month, it still wasn’t the country to send me the greatest number of page views. The United States was, as it ever is. Here’s the roster of readership by country.

Mercator-style map of the world, with the United States in dark red and most of the New World, western Europe, South and Pacific Rim Asia, Australia, and New Zealand in a more uniform pink. The exception is Finland, which is almost as dark red as the United States.
Finally, a challenging sphere-of-influence map for Victoria Revolutions players! It’s been ages.
Country Readers
United States 3,768
Finland 3,259
United Kingdom 197
Canada 157
India 150
Australia 113
Germany 79
Brazil 58
Sweden 45
Philippines 42
Singapore 37
France 36
Kenya 23
Italy 22
South Africa 21
Colombia 19
Nigeria 19
Denmark 17
Spain 16
Ireland 15
El Salvador 14
Chile 13
Mexico 10
Romania 10
Malaysia 9
United Arab Emirates 9
Czech Republic 8
Peru 8
Taiwan 8
Ecuador 7
Egypt 7
Hong Kong SAR China 7
Netherlands 7
Norway 7
Russia 7
Poland 6
Saudi Arabia 6
Austria 5
Belgium 5
European Union 5
Pakistan 5
South Korea 5
Switzerland 5
Thailand 5
Argentina 4
Bangladesh 4
Costa Rica 4
Jamaica 4
Japan 4
Lebanon 4
New Zealand 4
Bulgaria 3
Greece 3
Iraq 3
Jordan 3
Kuwait 3
Latvia 3
Ukraine 3
Vietnam 3
Hungary 2
Indonesia 2
Israel 2
Kosovo 2
Portugal 2
Bahrain 1
China 1 (*)
Cyprus 1
Dominican Republic 1
Guadeloupe 1
Guinea 1
Honduras 1
Kazakhstan 1
Mauritius 1
Montenegro 1
Morocco 1
Namibia 1
Nepal 1 (*)
Qatar 1
Serbia 1
Trinidad & Tobago 1 (*)
Venezuela 1

That’s 81 countries altogether, same as March, with 17 of them single-view countries. That’s up from March’s 13. China, Nepal, and Trinidad & Tobago are the only countries to have also sent a single page view in March. No countries are on a three-month streak. I am surprised to have seven page views from Russia, and three from Ukraine. I would have thought people in both countries have anything else to think about than my nonsense.


WordPress figures I published 16,407 words in April, which is almost suspiciously in line with the rest of the year. It’s the great formalism of that March Pairwise Brackety Contest Thing, must be. That and my decision to stop listing every single incident in the story strips in favor of summarizing plots. This all brings me to 66,248 words published for the year, and an average of 552 words per posting.

Between the events of Star Wars: The Last Jedi and the start of May, I’ve published 3,376 posts here. They’ve gathered 293,822 page views from 166,414 unique visitors, although have left most of those gathering dust in the linen closet.

If you’d like to be a regular reader, please be one. The RSS feed for essays is at this link, and if you need an RSS reader sign up for a free Dreamwidth account. You can add RSS feeds to your Reading page there. If you’ve got a WordPress account, you can click the “Follow Another Blog, Meanwhile” button at the upper right corner of this page. There’s also a box to have posts e-mailed as they’re published and before I can edit my typos. Thank you for being here and here’s hoping this is a good month ahead.

Statistics Saturday: Some April Holidays


  • April 1. April Fool’s Day.
  • April 4. April Fool’s Day Observed. (Scotland, West Australia)
  • April 6. Graperil Fool’s Day. (National Grape-Grower’s Association keeps insisting this is a thing and sends so many whiny e-mails if you don’t list it.)
  • April 12 – 17. News Sites Publish Articles Explaining How Something Kind of Like Some Part of the Miracles of Exodus or the Resurrection Could Maybe Have Happened Naturally So Christianity Is True, Okay?
  • April 13. Friday the 13th (Unobserved).
  • April 15. Calendar Nerds Explain How This Is Not The Ides Of April (United States).
  • April 16. Your Atheist Friend Goes on About How Not a Single Newspaper From Rome From 33 AD Mentions the Resurrection So Christianity Is False, Okay?
  • April 17. Your Pagan Friend Goes on About How “Easter” Is Originally a Pagan Word Meaning “Christianity Is Fake but Paganism Is Real” So Connect the Dots, People, Okay?
  • April 21. Day of Being Haunted by the Word Sequence “Haiku’ing for Space Ghost” and Trying to Think Why That’s In Our Heads And What That Could Possibly Even Mean. (Gen X only)
  • April 22. Conan O’Brien’s Birthday (Belated).
  • April 26. Moment of Silence Followed by Embarrassed Cough. (United States, Canada, Philippines)
  • April 31. April Fool’s Day (Extended Remix).

Reference: The Jersey Midlands, Henry Charlton Beck.

Statistics April: how Mark Trail once again gets people to sort of notice me


I do not keep obsessive, day-to-day track of my readership figures. I’m too prone to obsession for it to be good to track things that flutter so. But the panel used to post things has a little readership graph.

So I noticed a spike of views, and viewers, the 12th of April. And a bigger one the next day. Most of that spike evaporated by the 14th. But the readership was still appreciably larger than average for a week or so. And it wasn’t the spike from my post about what color tablet produces which Easter egg color. There was a spike from that, yes, but in the days leading up to Easter, like you’d expect. So what explains this 51st-anniversary-of-Apollo-13 spike?

(Daytime) photograph of the exit gate for Lakeside Amusement Park (Denver, Colorado), with the word 'REDIT' spelled out in (not yet illuminated) lights.
By the way, if you should have the chance to visit Lakeside Park in Denver, I highly recommend it. It’s got great piles of gorgeous 1930s-era amusement park architecture, a fantastic wooden roller coaster we didn’t get to ride enough, and one of the strangest carousels you could hope to ride. Also a fantastic and strongly democratic philosophy about ride pricing.

Yeah, it’s Reddit’s fault. A thread on the Hobby Drama Reddit described how James Allen left Mark Trail and how Jules Rivera joined it. The thread linked to one of the strips I’ve used in a What’s Going On In … post. And a lot of people clicked on that. So WordPress credited me with a lot more views, and viewers, than I’d otherwise expect. This was my most popular month by far, but, must be said, there’s an asterisk attached. I can’t fault anyone for linking to a picture I copied for fair use from Comics Kingdom. It reassures me in my judgement that these are important, representative strips I’m selecting. But I would like it if sometimes writers linked to my blog, or at least the tag, directly. It’d be nice to pick up a regular reader or two from these flash floods sometime.

Granting there is an asterisk, though, this gives me quite happy-looking readership figures. WordPress credits me with 9,423 views in April. This doesn’t quite double the twelve-month running mean of 5,160.6 views, nor does it quite double the twelve-month median of 4,930 views. It’s close to doubling, though, so I look forward to this messing up my mean and median comparison for a year to come. I’m also credited with 6,594 unique visitors, and that is more than double the twelve-month running mean of 3,047.7 visitors. And the twelve-month median of 2,937 visitors.

Bar chart of monthly readership for two and a half years. After several months that were higher than average April 2021 was extremely high, nearly double the average month from the past year.

In the figures that show some engagement? That’s all much more average. There were 140 things liked in April, which is pretty good lately; the twelve-month mean was 108.3 and the twelve-month median 108.5 likes per month. Nothing like the flush days of 2015, though, when there wasn’t a month below 279 likes. And there were 40 comments. This is exactly the median of the previous twelve months. The running mean was 42.0, so, I probably had a typical enough month with a heap of Reddit splashed on top.

So. I like looking at what posts were popular. The six most popular things this past month which were posted in March or April were:

I went to six, rather than give, just because I’m so stupidly fond of that Movie Mis-Quotes one. It might be my dumbest post ever and I don’t care. It’s glorious.

Of course, the things most sought-after are my comics posts. My plan for the coming month is to explain what’s going on in:

That’s just the plan, of course, and it’s subject to change if circumstances call for it.

World map with the United States in deepest red, and most of the Americas, Europe, South Asia, and the Pacific Rim countries in a more uniform pink. A handful of African countries are also in pink.
Wow, strange that it looks like nearly all those Reddit readers interested in Mark Trail drama were from the United States. How could that happen?

There were 93 countries, or things like countries, sending me readers in April. 27 of them were a single view each. Here’s the roster.

Country Readers
United States 6,785
Canada 444
Australia 408
United Kingdom 286
India 251
Germany 200
Philippines 83
France 79
Brazil 67
Italy 50
Sweden 49
Finland 46
Spain 42
South Africa 36
Norway 34
Singapore 33
Ireland 32
Portugal 31
Malaysia 27
Japan 26
European Union 23
Romania 21
Sri Lanka 21
Netherlands 20
Switzerland 20
Mexico 19
New Zealand 19
Indonesia 18
Thailand 15
Denmark 14
Puerto Rico 14
Chile 13
Belgium 12
South Korea 12
Greece 11
Poland 11
Pakistan 9
Turkey 8
Austria 7
Hong Kong SAR China 7
Russia 7
Argentina 6
Lebanon 6
Peru 6
United Arab Emirates 6
Bosnia & Herzegovina 5
Colombia 5
Hungary 5
Israel 5
Ecuador 4
China 3
Czech Republic 3
Kenya 3
Serbia 3
Trinidad & Tobago 3
Vietnam 3
Bahamas 2
Brunei 2
Costa Rica 2
Croatia 2
Egypt 2
Estonia 2
Jordan 2
Mauritius 2
Slovakia 2
Ukraine 2
Algeria 1
Bangladesh 1
Cambodia 1
Cayman Islands 1
Cook Islands 1
Cuba 1
Dominican Republic 1
El Salvador 1
Fiji 1
Georgia 1
Ghana 1
Isle of Man 1
Jamaica 1
Jersey 1
Kuwait 1
Latvia 1
Lithuania 1 (*)
Macedonia 1
Malta 1 (*)
Panama 1
Qatar 1
Sint Maarten 1
Slovenia 1 (*)
Taiwan 1
Tunisia 1 (*)
U.S. Virgin Islands 1
Venezuela 1 (*)

Lithuania, Malta, Slovenia, Tunisia, and Venezuela were single-view countries in March also. Nowhere’s been a single-view country three months in a row.


WordPress figures I posted 16,856 words in April, setting a new low for the year. This was an average of 561.9 words per posting in April. It gets me to 75,911 words so far in the year, an average of 633 words for each of 120 posts.

Between Margaret E Knight’s design of a machine to create flat-bottomed paper bags (1871) and the start of May 2021 (1st of May, 2021) I’ve posted 3,011 things here. These have drawn 232,879 views from 133,569 unique visitors.

I’d be glad to have you as a regular reader. This link is the RSS feed for my posts. If you don’t have an RSS reader, you can get one with a free account at Dreamwidth or Livejournal. Add any RSS feed to your reading page through either https://www.dreamwidth.org/feeds/ or through https://www.livejournal.com/syn. If you’re on WordPress, you should be able to use the “Follow Another Blog, Meanwhile” button to add it to your Reader page. And if you want, the link underneath “Follow Another Blog, Meanwhile” should let you sign up for e-mail delivery. I’m terrified of that one, since that sends out posts before I realize the three typos left in the article however much I proofread. But if that’s what you’re interested in, that’s what you’re interested in. Also every time I re-read an old post there’s more typos. No one has ever been able to explain this phenomenon.

Statistics April: How That Month Treated My Humor Blog


Better than I expected! Well, that covers that. See you next month, everyone.

Well, I have to talk a little more. My blog set a new readership record in April, topping — finally — the November 2015 spike when The AV Club noticed I wrote so much about how nothing was happening in Apartment 3-G. This can almost be explained by one thing: Easter. Particularly, Easter egg dying. I had taken pictures of what Paas-brand Easter egg dye tablets looked like, and what color they actually made eggs, and put that up on the web. And people were looking for exactly that. That page alone drew 1,057 views in April. This was even more than the home page for this blog, ordinarily the actual most-viewed page, drew. I figured that this would be a much-referred-to web site. I did not expect it to be that viewed.

Take away the 1,057 page views caused by the Paas corporation, though? And then … I … still have a record month for me. November 2015 saw 4,528 page views. April 2020 had 5,606 page views. That’s a gap of just more than 1,057 page views. It’s quite the spike. Some of that is probably spilloer from Paas-tablet-readers. But otherwise? Who’s reading and why? That’s what I look for here.

Bar chart of the last two and a half years' worth of monthly readership figures. After a drop in January 2020 the number of views and visitors have risen the last two months, with May towering above everyone.
The really good thing is now I have a replacement abnormally-great-readership-spike to look back on, as the November 2015 spike fades so far into the past that even the longest-range bar charts soon won’t be showing it.

So, yeah, the numbers look good, if we take more to mean good. 5,606 page views, way above the twelve-month running average of 3,638.5. Even discounting the Paas page, 4,549 page views would be a new record. There were 3,356 unique visitors, again way above the running average of 2,101.6. The down beat was that there were only 70 things given likes in all April, below he average of 123.1. Comments, though? There were 48 of them, way above the average of 16.6, and my best commenting month since January 2019.

Per-post, the figures are just about the same: 186.9 views per posting, above the average of 119.3. 111.9 visitors per posting, above the 69.0 running average. 2.3 likes per posting, below the average 4.0. 1.6 comments per posting, way above the 0.5 average. I’d like to think this sort of viewing and commenting is a trend that’ll continue, but I understand how much of it is juiced by Paas.

So what was popular? Paas tablets and what else? The top posts in April were:

  • Which Color Paas Tablet Is Purple? Which is Red? Which is Pink?
  • Why does Mallard Fillmore look different now? What happened to Bruce Tinsley?
  • Statistics Saturday: The Months Of The Year In Reverse Alphabetical Order
  • What Is Going On With Mark Trail?
  • Why does Mark Trail look funny? Did something happen to James Allen?
  • As you see, what people really want to know from me is why comic strips look weird today. Mallard Fillmore, that’s easy to say. Loren Fishman has taken over as “guest cartoonist” until Bruce Tinsley returns. Don’t care. I’m not reading Mallard Fillmore unless I hear it’s great from multiple independent lines of trusted references.

    April’s most popular thing I wrote in April was Emotional Drafting, one of my long-form essays. And one focused on a little bit of coping with Covid-19, in an extremely small and me way. The most popular statistics piece was Where Comic Strips Are Set. I mention because I hope linking to it will make it easier for people to find. Legitimately: Wikipedia reports Chic Young, the creator of Blondie, asserted in 1946 that the strip was set near Joplin, Missouri.


    514 posts got at least one viewing in April, up from 484 in March. 323 got more than one view, up from 302 in March. 76 of them got at least ten views, which is basically tied with March’s 75.

    78 countries sent me any viewers at all in April. That’s right about March’s 73 and February’s 71. 19 of these were single-view contries, basically the same as March’s 20 and February’s 18. And here’s what they were:

    Mercator-style map of the world with the United States in darkest pink. Most of the Americas, Europe, Asia, and Australia and New Zealand are in a roughly uniform pink. A random smattering of African nations are similarly pink.
    Hi, reader in Burkina Faso.
    Country Readers
    United States 4,474
    India 191
    Canada 149
    United Kingdom 125
    Australia 90
    Germany 57
    Italy 42
    Sweden 33
    Mexico 28
    South Africa 26
    Philippines 24
    Brazil 21
    Colombia 21
    France 19
    Netherlands 18
    Ireland 16
    New Zealand 15
    Kenya 14
    Spain 14
    Finland 13
    Pakistan 12
    China 10
    Indonesia 10
    Norway 10
    Peru 10
    Russia 10
    Singapore 9
    Belgium 8
    Portugal 8
    Turkey 8
    United Arab Emirates 8
    El Salvador 7
    Malaysia 6
    Poland 6
    Switzerland 6
    Ecuador 5
    Hungary 5
    Thailand 5
    Argentina 4
    Romania 4
    Taiwan 4
    Bulgaria 3
    Chile 3
    Israel 3
    Laos 3
    Moldova 3
    Nigeria 3
    American Samoa 2
    Bahrain 2
    Costa Rica 2
    Czech Republic 2
    Denmark 2
    Estonia 2
    Hong Kong SAR China 2
    Jamaica 2
    Serbia 2
    Sri Lanka 2
    Ukraine 2
    Zambia 2
    Austria 1
    Bangladesh 1 (*)
    Burkina Faso 1
    Croatia 1
    Egypt 1 (*)
    European Union 1
    Guadeloupe 1
    Guatemala 1
    Japan 1
    Lebanon 1 (**)
    Mauritania 1
    Nepal 1
    Oman 1
    Saudi Arabia 1
    South Korea 1
    Suriname 1
    Uruguay 1
    Venezuela 1
    Vietnam 1

    Bangladesh and Egypt wee single-view countries in March too. Lebanon is on a three-month streak of single views. Also … really, wow? Only one page view from Japan? I know I write a painfully parochial blog, but Japan also has like 750 million people who can read English in it. I’d think just by accident it would have to out-draw, like, Suriname. Which again is nothing against Suriname; I just think of what I write and totally get nobody in Suriname caring.

    And what do I write? Well, late Thursday, Eastern Time, I post a long-form essay, trying to get to around 700 words. Saturday nights I post a Statistics Saturday thing, some joke that can be a list or a pie chart and that doesn’t save as much time to write as you’d think. And then, at least this cycle, I’m trying out putting my What’s Going On In Story Strips posts on Tuesdays. My plan for the next month is:

    This is always subject to change in the event of fast-breaking story comic news or my deciding I want to do something different.

    As WordPress counts things I posted 19,010 words in April, for an average post length of 633.7 words. This is quite up from March’s 17,019 words and 549 words per posting. So, yes, I’m getting longwinded again. For the year through the start of May I had published 67,888 words in 119 postings. This averages 571 words per posting.

    The start of May saw me posting 2,646 things, viewed a total of 167,135 times by 93,757 unique visitors.

    If reading a bunch of numbers about posts has encouraged you to read me regularly, all right, that’s a valid choice. You can follow this blog in your WordPress reader by clicking the “Follow Another Blog, Meanwhile” button. Or you can add my RSS feed to whatever reader you use. If you don’t have an RSS reader, sign up for a free account with Dreamwidth or Livejournal. Their Friends pages let you add RSS feeds from anywhere. And you can catch announcements of these posts on my no-longer-inaccessible Twitter account, @nebusj. Thank you for reading, if that is what you’re doing here. Take care, please.

    Statistics April: What, if Anything, was Liked Around Here All Month


    The most-read month I ever had around here was November 2015. This was at the height of the Apocalypse 3-G, when I was doing weekly updates on how nothing was happening in the comic, and even the Onion AV Club noticed, although not enough to mention my name. I got 4,528 page views from 2,308 people, many of whom just trusted the AV Club that I had something to read. I figured, well, that’s great. That’ll never happen again, though.

    I’ve still not drawn the attention of AV Club, or any other significant blog reviewer. But I’m starting to believe I might someday reach that popularity peak on my own right. Or, at least, my own right with the assist of Roy Kassinger, who I think single-handedly added a thousand page views a month around here.

    So that all brings me to the readership report for April 2019. Things had been on an uptick: February saw a weirdly low, for these days, 2,428 page views from 1,429 unique visitors. March saw a more normal-for-now 3,565 page views from 2,165 unique visitors. April?

    Several years' worth of monthly readership numbers. It's mostly a gradual waving pattern, the peaks of the waves getting noticeably taller at the start of 2017 and at 2018 again. The exception is the big peak in November 2015, higher than even the April 2019 peak.
    So it turns out those little arrows on the far left and right of ‘Stats for April 2019’ will let you move the month under focus, including off to the left from the leftmost of the months. This is how I learned to get the larger ranges like I’m showing here.

    That was 4,033 unique views — the first time I’ve been above four thousand page views — in a month since the AV Club mention. And from 2,418 unique visitors, beating the Apocalypse 3-G high. That’s astounding. That’s … the doing of Apartment 3-G, once again. A message board I never heard of before got to reminiscing about the comic strip, and how bad it got, and so I got mentioned. I’m never so successful as when comic strips are failing.

    So that was popular. An average of 134 pages viewed per day, the greatest number since November 2015’s average of 151, only this with a smaller variance.

    There were 233 things liked around here in April, up from March’s 176 and February’s 156. I think I was also helped by someone mentioning the Popeye pinball game fiasco, over in one of the big pinball web forums. But the number of comments fell: there were only ten around here all April. There had been 24 in March, and 34 in February. 10 is the fewest comments in a month here since May of 2017. And that’s weird. It’s hard for me to imagine, but the statistics pages are there: in December 2014 I got 138 comments in the month. I know sometimes WordPress has counted pingbacks, links from one blog entry to another, as comments. But still. I don’t link to myself that much, and nobody links to or reblogs me. (And not because I don’t like it. I love the attention! I think I just have the sort of writing that people don’t care to reblog.)

    And for popular articles? Well, my conversion into a full-time chat-about-comic-strips blog may as well be complete. If I ever need some time off — and I’ve been thinking about it — I may just set everything but the weekly story comic update on repeat. But the things people wanted to read most:

    For non-comic-strip stuff my most popular thing in April was Which Color Paas Tablet Is Purple? Which is Red? Which is Pink?. I knew this would be popular. I did not know Paas had changed the formula so you could put tablets into vinegar or not as you like so it doesn’t matter which is which so much.

    For non-comic-strip, original, long-form essay stuff, you know, the thing I originally thought this blog was about with everything else just propping it up? My most popular thing was .. uh … hang on … it must be here somewhere. All right. Yes. Tied for the 68th most popular posts: Everything There Is To Say About Hurt Feet Except For What I Forget To Say, and In Which I Imagine Having A Job I Would Be Very Bad At, and finally All Kinds Of Thoughts About A Bucket Of Water And The Universe. Goodness but I’m such a nerd.

    Mercator-style projection map of the world. The United States is the darkest red, and India the next-darkest. Much of Europe, southeast Asia, and the Americas are a similar light pink.
    So this map makes me wonder, what is my personal Pole of Inaccessibility, the point on the planet Earth farthest from any country that sent even a single reader to my blog in April? And this is why I am a humor blogger rather than a popular humor blogger.

    66 countries sent me readers in April, down from March’s 69, and up from February’s 65. 16 of them were single-reader countries, compared to 14 in March and 15 in February. Here’s the full roster:

    Country Readers
    United States 2,981
    India 341
    Canada 116
    United Kingdom 87
    Australia 67
    Sweden 43
    Brazil 34
    Germany 29
    France 22
    Hong Kong SAR China 22
    Italy 21
    South Korea 21
    Norway 15
    Philippines 14
    Spain 14
    Netherlands 13
    Denmark 12
    Finland 12
    Malaysia 12
    Portugal 10
    Singapore 10
    Chile 9
    Russia 9
    United Arab Emirates 9
    South Africa 8
    Japan 7
    Pakistan 7
    Thailand 6
    Ireland 5
    Israel 5
    Belgium 4
    Indonesia 4
    Mexico 4
    New Zealand 4
    South Sudan 4
    Taiwan 4
    Trinidad & Tobago 4
    European Union 3
    Nepal 3
    Austria 2
    Bangladesh 2
    Colombia 2
    Greece 2
    Hungary 2
    Jamaica 2
    Jordan 2
    Kenya 2
    Montenegro 2
    Poland 2
    Turkey 2
    Argentina 1
    Bahrain 1
    Bulgaria 1
    Cameroon 1
    Egypt 1
    El Salvador 1
    Estonia 1
    Ghana 1
    Isle of Man 1
    Latvia 1
    Mongolia 1
    Nigeria 1
    Romania 1
    Saudi Arabia 1 (*)
    Serbia 1 (***)
    Sint Maarten 1

    I’m happy to have readers from anywhere. I do feel like, for how much all my writing reeks of generic American white guy, it’s weird that I had so many readers from India and from Sweden this month. Finland, Norway, and Denmark too. Not intending any offense but is it possible the Scandinavian countries have mistaken me for someone else?

    Saudi Arabia was a single-reader country in March. Serbia has been a single-reader country four months in a row now. Nowhere else has a streak like that going, though.

    My plan for story strip recaps for the coming month — subject as ever to change for breaking news — is this:

    All story strip recaps should appear at this link. If one doesn’t, it’s because I messed up a tag. Let me know and I’ll fix something.

    From the start of the year through the start of May I’ve posted 120 things around here. That’s made for a total of 73,242 words. This implies I published 19,339 words in April, a bit more than the 18,577 of March. Hm. That’s slightly over 644 words per post, so that to date my average post is 610 words. That’s up from the start of April’s average of 599. So I need to work harder on those dumb little bits of wordplay for Wednesdays. Maybe I need to post more pictures alone.

    I’ve gotten 166 total comments on the year, for an average 1.4 comments per posting. At the start of April it had been an average 1.6 comments per posting. 689 total likes, as of the start of May, for an average of 5.7 likes per posting. At the start of April it had been an average 5.5 likes per posting. Hm.

    I start the month with a total of 2,280 posts, and 121,901 views from a supposed 67,592 unique visitors. 565 posts got at least one viewer at all in April. This seems like a large number, but I’ve only got the March 2019 data to compare it to. That month had 420 pages viewed by somebody.

    And with all that said, I’d be glad to have you as a regular reader. You can do that by reading things off the RSS feed. Or if you want me to get data that I fail to analyze about what you read, use the “Follow Another Blog, Meanwhile” button in the upper right corner of the page. And I’m also on Twitter as @Nebusj. If you’re not sure about that, I try to start each month with a pair of pictures of rabbits, eg:

    So there’s that to look at.

    Statistics Saturday: The Seven-Day Minus-Forecast


    • Sunday: 1st April
    • Monday: 2nd of April
    • Tuesday: 3rd of April
    • Wednesday: 4th of April
    • Thursday: 5th of April
    • Friday: 6th of April
    • Saturday: 7th of April

    Reference: The Mathematical Experience, , Philip J Davis and Reuben Hersh.

    Statistics Saturday: The Seven-Day Forecast


    • Sunday: Early April
    • Monday: Early April
    • Tuesday: Early April
    • Wednesday: Mid-April (already!)
    • Thursday: Mid-April (seriously?)
    • Friday: Mid-April (just, wow)
    • Saturday: Mid-April (I mean, 2019 started so recently it’s still like 2018)

    Reference: The Rocket Men: Vostok and Voskhod, The First Soviet Manned Spaceflights, Rex Hall and David J Shayler.

    Statistics April: Nancy Turns Out To Be A Gift To Me


    All right, so, I have my reasons to suspect that the new artist doing Nancy will have caused strange things to happen to my readership statistics. Let me just check here.

    Yeah, OK, so that’s roughly what I figured. There were 3,590 page views around here in April. Down from March’s 3,773 but still. That’s four months in a row I’ve been above 3,590. This is going to go so to my head. There were 1,988 unique visitors as best WordPress can tell; that’s the greatest number of unique visitors since Apocalypse 3-G. Still hasn’t quite broken 2,000, though. There were 1,917 in March and 1,982 in February and there we go. I need to troll more obviously for unique readers.

    The reader-engagement stuff dropped again. A mere 177 likes in April, down from 241 in March or 207 in February. The number of comments plummeted to 43, down from 84 and in February 121. With this trend I can expect May to see eight comments. That sounds about right.

    Bar chart of readership figures, with four months in a row of total views between 3,500 and 4,000.
    It just looks so adorably like the Central Business District is building a whole mess of new skyscrapers. I think it’s got a better composition than last month’s chart had.

    So why do I say the new Nancy brought me readers? First, here’s the top five posts from the month:

    So I know some of what happened. The new Nancy is getting a lot of comment, including from the Onion’s AV Club. I expect that the AV Club articles about Nancy have as related posts Apartment 3-G talk, and that would bring some attention to my updates about how nothing was happening in the strip before the strip stopped happening altogether. A lot of the most popular posts after the top five were Apartment 3-G-related, or features of other comics. The most popular piece that wasn’t about comic strips was In Which My Calendar Wants Me To Do The Unthinkable, and that was like the 218th most popular posting in April. The most popular long-form original piece was If It Is Not The End Of The World, and that wasn’t all that well-liked. The most popular statistics piece was What Textbooks You Need To Major In Mathematics so at least amusing exactly myself works for some people.

    There were 76 countries sending readers here, which is way over March’s 75 or February’s 70. Of those countries 21 were single-reader ones, down from 25 but up from February’s 18. I don’t know what’s happening there. Still, here’s the roster of them:

    Country Readers
    United States 2,882
    Canada 148
    India 71
    United Kingdom 70
    Brazil 29
    Australia 27
    Germany 26
    South Korea 22
    France 19
    Singapore 18
    Italy 17
    Mexico 11
    Norway 11
    Denmark 10
    Finland 10
    Indonesia 10
    Russia 10
    Spain 10
    Sweden 10
    Switzerland 10
    Portugal 9
    Romania 9
    Hong Kong SAR China 8
    Netherlands 8
    Philippines 8
    Ireland 7
    Israel 7
    Serbia 7
    United Arab Emirates 7
    European Union 6
    Hungary 6
    Poland 6
    South Africa 6
    Chile 5
    Japan 5
    New Zealand 4
    Trinidad & Tobago 3
    Turkey 3
    Argentina 2
    Bangladesh 2
    Bulgaria 2
    Czech Republic 2
    Estonia 2
    Greece 2
    Kenya 2
    Laos 2
    Lebanon 2
    Lithuania 2
    Malaysia 2
    Pakistan 2
    Sri Lanka 2
    Taiwan 2
    Ukraine 2
    Venezuela 2
    Vietnam 2
    Austria 1
    Cambodia 1
    China 1
    Costa Rica 1
    Egypt 1
    Georgia 1
    Ghana 1
    Guam 1
    Iraq 1 (**)
    Jamaica 1
    Latvia 1 (*)
    Macedonia 1
    Mauritius 1
    Montenegro 1
    Myanmar (Burma) 1 (***)
    Nepal 1
    Puerto Rico 1
    Slovakia 1 (*)
    St. Kitts & Nevis 1
    Thailand 1
    Uganda 1

    I’m surprised to see how much the United States readership dropped (3,111 in March to 2,882 in April) and that other countries picked up most of the readership gap. Latvia and Slovakia were single-reader countries for the second month in a row. Iraq for the third. Myanmar/Burma is on its fourth month on this single-reader streak.

    Insights tells me that as of right now — the 1st of May, with that piece about old-time-radio-based movies being on TCM — I’ve had 121 posts so far this year, drawing 265 total comments and 812 total likes. My word total is up to 82,553, indicating I wrote 18,630 words for here. Add to that the 8,494 words I wrote for the mathematics blog and I ground out 27,124 words for my WordPress blogs. That sounds impressive until you consider how many of those words were either “well”, “just”, or “since”. (7,422 of them.)

    The Insights panel says my average post has been 682.3 words. At the start of April that was 687.3. The average post got 6.7 likes, down from 7. The average number of comments was 2.2 per post, same as through the end of March.

    I’d like to invite you to keep reading Another Blog, Meanwhile. I haven’t turned on the subscribe-by-e-mail option, although I’m considering it. You can add this to your WordPress reader by using the “Follow Another Blog, Meanwhile” button in the upper right corner of the page. There’s an RSS feed of articles that you can use too. There’s also an RSS feed of comments although I don’t know why that’s an option. I suppose for blogs that get to actually discussing things in depth. And finally over on Twitter I’m @Nebusj and I do try to announce new posts when they’re ready. Thanks for reading and whatnot, all not-quite-two-thousand of you.

    Statistics April: What Was Popular-Ish Around Here


    So, my conversion of this blog from miscellaneous humor stuff into comic strip review goes well. According to WordPress’s statistics I had some 1,765 pages viewed from 1,099 distinct readers in April. That’s down from March’s 2,085 pages from 1,308 visitors. But it’s near enough January’s 1,837 views from 1,093 visitors that I’m not going to go fretting nonstop about that. If nothing else, April’s “What’s Going On In” comics were about stuff like Gil Thorp and Alley Oop, which people don’t find as ironically fascinating as Mary Worth or Rex Morgan. Oh, I had Judge Parker, surely a perennial, but also Spider-Man which has too strong a narrative drive to really confuse people.

    No, what I’ll fret about if you don’t mind is the number of pages liked. There were 147 ‘likes’ clicked around here in April. That’s not far off March’s 154 or February’s 169. But WordPress increased the range of months I can see on the chart. That’s made me realize the ‘likes’ around here have been trending downward, like some exponential decay, since about March of 2015 when there were 443 likes. I haven’t dug in to see how what I wrote differed back then from what I write now. But I wonder. Wouldn’t you? If you’re reading this far into my data moping here, you wonder at least a bit.

    Monthly 'likes' statistics for nebushumor.wordpress.com. It peaks in March 2015 and mostly declines, with fluttering variations, through to April 2017.
    You can actually see me grow less likable!

    Comments have a similar-looking decline. Oh, they were up in April, to 26 from March’s 12 and February’s 15. That still shows a steady decline, though. I won’t bother with a picture of that over the course of months. Sometime last year — I forget when — I shifted the way I link to old stuff. The new way doesn’t show up as a comment on the linked essay, so that I have a truer count of how many things people are saying something about. On the other hand, this does mean the page referred to doesn’t show that it’s been referred to by anything else. Maybe I should go back to the old way; that might help people archive-binging find other interesting stuff. If you know anyone who’s archive-binged my little thing … uh … thank you. I’d like to hear what makes it easier, though.

    The top articles around here the past month? Mostly comic strip plot summaries. I suspected this would happen, and accepted it. I’d like to be known as a sometimes-absurdist humorist plainly in the Robert Benchley tradition, but if my ability to pay attention to Gasoline Alley is of more use to the world, fine. Nobody ever gets famous for what they want to be famous for.

    The most popular creative thing I wrote was my Statistics Saturday post Some Now-Obscure Professional Baseball Players Given Nicknames Anachronistically which is just the sort of slight, over-researched thing that I like. The TV installation thing was my most popular long-form original piece, which shows the power of giving a title drawn from one of the Buggles’ other songs. (They have more good songs than you realize.) And my talk about Mystery Science Theater 3000 and me (part one, and part two, and part three) placed well, which is comforting considering how hard it is sharing feelings and all.

    Now on to a big old list of countries and readers! Everyone likes those, unless they go unlisted. In which case it’s something they could fix themselves, isn’t it?

    Country Views
    United States 1341
    Canada 78
    India 78
    United Kingdom 74
    Romania 17
    Germany 13
    Australia 12
    Netherlands 11
    New Zealand 11
    Spain 11
    Italy 9
    Poland 8
    Sweden 8
    Philippines 7
    South Africa 7
    Hong Kong SAR China 5
    Indonesia 5
    Mexico 5
    Brazil 4
    Finland 4
    France 4
    Turkey 4
    Chile 3
    European Union 3
    Ireland 3
    Singapore 3
    Argentina 2
    Denmark 2
    El Salvador 2
    Greece 2
    Japan 2
    Malaysia 2
    Qatar 2
    Russia 2
    Switzerland 2
    Thailand 2
    Trinidad & Tobago 2
    Uruguay 2
    Bolivia 1
    Czech Republic 1
    Egypt 1 (*)
    Kenya 1
    Madagascar 1
    Norway 1 (*)
    Pakistan 1
    South Korea 1
    Sri Lanka 1
    Taiwan 1 (*)
    Turks & Caicos Islands 1
    Ukraine 1
    United Arab Emirates 1

    I make that out to be visitors from 51 countries, down from March’s 55 and April’s 61. There were 13 single-viewer countries, down from March’s 14 and February’s 22. Egypt, Ukraine, and Taiwan are the only three countries that were single-reader countries in March also, and March was a complete single-reader turnover from February.

    I start May with 52,737 page views from 28,546 distinct visitors, I’m told. WordPress says the most popular day, with 16 percent of views, is Wednesday, just as it was in March. It says the most popular hour, with 13 percent of views, is once again 12 am. That’s down from 15 percent the previous month.

    WordPress figures I start the month with 729 readers here, up from 725. I’m flattered to see any follower that hasn’t two days later had their blog closed or made private or whatnot. You bloggers who follow your statistics obsessively know what I’m talking about. If you’d like to join them there should be the “Follow Another Blog, Meanwhile” button off on the right side of the screen. Or you can follow by e-mail, joining a group of elites such as my dad. And I’m also @nebusj on Twitter, where I supposedly have 237 followers, and won’t try to scare any of them off. Thank you, won’t you?

    Another Blog, Meanwhile Index

    The index gained a point when investors were sweeping out the corners like they’ve been promising to all week and saw one had rolled under there, raising hopes for what might happen if they ever do that proper whole-floor mopping they’ve been talking about since March.

    121

    From The April 2017 Scraps File


    Free to good home. Please be gentle. Many of these sentence fragments had hopes of being put to a useful purpose.

    I’m not saying the world should work like all 70s Hanna-Barbera cartoons. It’s too heavy a load on the continuity of the world to have one in which we have cyborg Three Stooges, slice-of-life football players, and space-cop Casper the Friendly Ghost coexisting.
    — cut from that bit yesterday where some bands were listed playing in two venues at once because if I start letting my brain vent genially dumb cartoons I used to watch obsessively I will never stop and that’s some dangerous stuff to let out.

    Baseball had trouble in its early days because it was hard to think of good team names. They started with teams like the Troy Trojans, the Philadelphia Phillies, the Providence Providentials, the Chicago Illinoisians, the Detroit Michiganders, and so. — cut from my ramblings about baseball because that bit was getting long enough already and because I couldn’t find a good resolution. Some more obvious-place-name spots, like, “the Dover Delawarians”? Some fanciful like “the Sea Girt Grit”? Something that’s over-researched and a little bit off like, “the Queens County Superbas”? I don’t know. Maybe this just needs to be let to brew longer.

    [ A bulk lot of about 650 words regarding the controversial plan by the International Flipper Pinball Association, one of the organizing bodies for competitive pinball, to charge one dollar per player per event for certifying rated events; serious inquiries only. ] — a whole presentation which would have been good for some pinball forum about the hotly debated “IFPA Tariff” which I realized I don’t have a use for because (a) “tariff”, like “sheriff” and “sergent”, belongs to the class of words that always look to me like I’m spelling them wrong no matter how many times my spell-checker and DuckDuckGo tell me I’m doing fine; and (b) because while I’m not an expert I’m pretty sure this is an “excise” and not a “tariff”. Actually that’s what has me most riled up. It makes me realize that yeah, actually, everyone treating me like that in middle school had a point. You don’t want to do things that make you learn that about yourself. But I’m right, right, about this being more nearly an excise than a tariff?

    There’s stuff about a teenaged boy body that are beyond anyone’s control. After a couple hours trying to get through the unformed judgement centers and the free-floating resentment even the teenaged boy himself stops trying to deal with him. So — I’m just giving up trying to follow up that thing about antiperspirant with some more of my mild body-dissatisfation and I can’t get that stuff to go anywhere. If you have a body or know someone who does, give it a try.

    https://en.wikipedia.org/wiki/Corrugated_galvanised_iron — a particularly haunting scrap. I’ve had it in my notes as something I could do something with just forever and I can not think of any reason why. There’s some pleasant words in the Wikipedia article, like “roll forming”, but that can’t possibly be enough. If you see whatever it was I saw when I made that note, just let me know. I can’t just be thinking to mock the claim that corrugated galvanized iron is occasionally abbreviated “CGI”.

    Not that I mean to blow your mind but you do realize there’s not a word in the canon to suggest Romulans even had deflector shields in the era of the Original Series. — cut from a TrekBBS discussion because whether there’s any word depends on whether you accept some logical inferences from Star Trek: Enterprise or whether you’re considering merely the canon of the Original Series as it existed when the show wrapped in 1969 (or whether you include the cartoon, 1973-74, which I’m inclined to). But if you are willing to consider this it considerably reduces some of the plot holes in the episode where Kirk goes undercover as a crazy guy to steal a cloaking device and oh there I go with understanding middle school again.

    Another Blog, Meanwhile Index

    The index fell a point today as investors ran out of singles for the change machine.

    120

    Statistics Saturday: The Ides Of April, This Century


    Times I Have Been Ready To Inform Someone In Casual Conversation That The 15th Is Not The Ides Of April, The 13th Is 17
    Times The Conversation Has Ever Come Remotely Near This Topic 0
    Times A Comic Strip I Read Has Used This As The Base For A Joke 2
    Times I Noticed In Time To Comment On This In A Timely Fashion 0

    Plus is the 15th even the Income Tax Filing Deadline in the United States anymore? It seems like it’s always bumped to like the 18th of April or the 44th of May or the 216th of Freaking October anymore. I don’t know. And yeah, the ides are the 13th day of a 30-day month, plus February, and anyway the Romans listed days as counting down to the next big calendar event day, so that the 15th of April would be “17 Kalend May”, which everyone understood to be part of April, not May, and also they sometimes slipped an extra month in between the 24th and the 25th of February. This is why the Emperor Vespasian was never able to get his programmers’ database software to handle dates correctly. Neither can we.

    Another Blog, Meanwhile Index

    The index rose another point while wait, that thing in the Chocolate Swamp is named Gloppy? Also there’s a Chocolate Swamp in Candy-Land? We thought it was the Molasses Swamp? Or are there multiple swamps? Did it change? What is this? What are things? What is changing? Why?

    135

    From The April 2016 Scraps File


    Bits from my scrap file that I couldn’t use in April 2016. Free to good home. No pedigree available on metaphors. Papers available upon request but don’t ask me to whom.

    When I say it makes my hair look “good”, I mean it looks good enough for me. By “enough” I mean there’s room for obvious improvement. By “improvement” I mean a general bettering-ness of things. By “me” I mean the same old person I meant last time, only a little older. — Cut because I could swear it’s a Robert Benchley thing and while I would get away with it, I would know. And by “know” I mean “know”. By “I” I mean “me”, but in a different case.

    seeming like it might be — Man, again I have this cropping up everywhere. I’m not even trying to write it, it just appears.

    And then the label on the pumpkin can says “Good to connect! Visit us at LibbysPumpkin.com”. — Cut from the pumpkin can label because E M Forster rose from his grave to warn me that this was not even in the slightest what he meant. “It’s a can of pumpkin innards,” he said, “What could you possibly have to talk to anyone about that? There is no elaboration possible! Pumpkin innards are a complete explanation of themselves!” On hearing this, the ghosts of René Magritte and Alfred Korzybski got a heated quarrel going about whether a pumpkin was a sufficient representation of a pumpkin. They’ve been going at this since last Saturday and I would say I’m sorry to have got the whole thing started. Except that as a side effect Forster and the ghost of Marshall McLuhan have been watching my Arrested Development DVDs. You wouldn’t think that’s the kind of show someone could riff on, Mystery Science Theater 3000-style. They don’t, not exactly. But their commenting’s got pretty sharp stuff anyway. Also the ghost of Korzybski has been in the dining room giving those “I’ve got my eyes on you” fingers to our picture of Immanuel Kant.

    Nutmeg was supposedly so powerful it could bring things back to life, which makes it weird they’d use it to cover the taste of rotted meat. Would you want a slab of rotten mutton or whatever they ate in the 16th century coming back to life? But I understand scholars don’t believe Europeans were covering the taste of rotted meat anymore anyway. That makes more sense to me. Spices needed years to get from the East Indies to, say, Sheffield. Animals were right there. It’s much more plausible if Europeans used fresh meat to cover up the taste of rotted spices. — Cut from that time-in-New-Jersey essay because I’m not sure where I got that bit about nutmeg curing death. I’m pretty sure I read it in Giles Milton’s Nathaniel’s Nutmeg: Something Something Or Other Something Spice That I Just Bet You Changed The World but I don’t know where my copy is. And maybe Giles was having a little giggle with us all. If anyone knows him please ask and let’s find out. Also I really thought that time-in-New-Jersey post would get more interest from the standards-enthusiast community here. Go figure.

    But then a fantastic arrogance has always been your truest métier. — Cut from that letter I’m still working on to that estranged friend because I am getting to wonder what exactly I ever got out of that friendship.

    Ghostbusters became a thoroughly enjoyed icon of pop culture despite the warning that it was a years-in-development labor of love by Dan Aykroyd. — Snipped when I remembered there are already plenty of opinions about Ghostbusters on the Internet and that doesn’t mean I have to have one too.

    Cartoon Characters That Have Been Caught In Giant Snowballs Rolling Down Mountains. — Cut from a potential Statistics Saturday post when I realized I couldn’t name all that many. There’s ThunderCat Lion-O, of course. Also Betty Boop. But after that? I would guess it’s happened to Bugs Bunny. And probably on Hanna-Barbera’s 1960s series Character Who’s Got One Catchphrase And A Bow Tie And That Will Have To Do For 17 Episodes. I guess Breezly and Sneezly. But that’s not a list. That’s a partially baked idea and there’s no sign that the Magritte-Korzybski quarrel will heat it well enough to finish.

    Statistics Saturday: April Fool’s Day, By Content


    Maybe 1% pranks; 4% the 'Find The Mistakes' episode of The Price Is Right, and the rest is people complaining that someone went and played a prank, or maybe was just thinking about it.
    Although, yeah, Gmail, what were you thinking?

    But you can understand people being angry at April Fool’s Day, what with the Internet being flooded with dubious news stories, jokes in questionable taste, ill-considered surprise changes in web sites, and causes for phony outrage, only we know ahead of time the day’s going to be full of them.

    What I Couldn’t Write In March 2016


    Pieces from March’s scraps file. All text free to a needy author that can use it. Better luck with it than I had.

    seeming like it might be — cut from like ten essays this past month because it doesn’t mean anything. It just slows down moving from the start to the end of the sentence. I don’t ever have any reason to put that in somewhere. I just type a while and look up and there it is and I have to eradicate it. This is some kind of grammatical zebra mussel. I would just leave it in a trash bin, on fire, but if you really want it go wild. Sorry. The rest of the scraps are more promising. Don’t take this one.

    So I admit to being torn about National Haiku Pedantry Month coming up this April. We need to get some discipline back into the art form. Right now it’s just what people use for comic verse when they aren’t up to writing a limerick. But then we have thirty whole days of having to pretend we approve of haiku pedants. Some of these people are fine, pointing out that there are actual syllable counts and it’s not just a short-long-short line thing. But then there’s the guy you know who’s going to leap up on a desk, shaking a yardstick around, and hollering, “It’s not just syllable count! You need nature imagery and a cutting word! Where is the cutting word in this? Well?” And you just know he goes home to sulk that all he can find are yardsticks around when it would just make his day to get a meter stick. A haiku pedant like that isn’t going to pass up a good fight with the Pun Control Squad. You know them. They admit there might be such a thing as a pretty good, amusing pun, but they haven’t seen one. And they’re going to take action. — Cut because, of course, National Haiku Pedantry Month is November.

    very — cut from about forty posts this past month because I don’t even like having it there. It’s just too easy to make my minimum word count. Also I guess I have a minimum word count even though all my popular posts are two paragraphs long and comment on a picture from the store.

    So we trust that we have commutivity and that there’s a multiplicative identity within the collection of elements. And that if the product of two things is zero then at least one is zero. I know that sounds crazy, like specifying that a triangle has to also not be a square. But this can happen, and let me show you how. — Cut from my essay about Dedekind Domains because I realized I wasn’t even halfway toward saying all the rules one of these things had to meet and oh good grief this is why people hate mathematics.

    You in your spectacle of arrogance, incapable of imagining that someone other than you might ever need something that isn’t “the chance to gaze in adoration at your alleged magnificence” — Cut from a draft letter to an estranged friend I’ve been trying to reconcile with even though it’s seeming like it might be hard to figure out why, exactly.

    I perused the closed-captioning transcript of this episode so that I can say with confidence — cut from a TrekBBS post about Star Trek: Voyager because we were debating a Kes episode and who’s got enough time in their lives for that? Not Kes, obviously. Ha ha! I’ll explain why that’s funny in a footnote [1].

    This hoodie makes me feel pretty, oh soooo pretty. — Cut from the back of an index card we were using to keep track of scores at a pinball tournament yesterday. Not sure who wrote it. It’s seeming like it might be one of our friends who had some hard luck on the game Jack-Bot. But he has got a hoodie that’s become a merry in-joke ever since the state championships back in February.

    Go off and be happy, insofar as you think that’s wise. — Cut from waving bye to a friend because it does sound kind of Ashleigh Brilliant-ish.

    [1] It’s funny because I was trolling for the chance to show off that I know what “peruse” means. The chance never came, and never does.

    Statistics April, Concluded


    Yesterday’s mutterings about my suspiciously absent audience is enough of that. May started with my blog at 16,472 views total, which isn’t bad at all. The most-read posts of April make for an interesting bunch, to my eye, because … well, here:

    1. Statistics Saturday: Nations of Europe Ordered By Length, which was popular because people like lists of countries, and some folks were wondering just what I was getting at with all this.
    2. Betty Boop: Musical Justice, again not a surprise to me because it’s a weird and rare bit of Betty Boop arcana. This was one of her two live-action appearances.
    3. When We All Stopped Watching Deep Space Nine, a Caption This! item featuring that first-season episode where gamers from the Gamma Quadrant invaded the show. That inspired the question of “Allamaraine, is this worth the trouble of watching?” Fans of the show say yes, it got a lot better after this. Maybe so. Every time I tried watching it was a time-travel nonsense or a Ferengi Comedy Episode and I don’t need either of those in my life, thank you.
    4. Power Challenge Of The Week, drawing on everyone’s giddy delight at insulting Brutalist architecture.
    5. Betty Boop: Dizzy Dishes, another unsurprisingly popular piece because it’s got what’s always credited as the debut of Betty Boop. Betty Boop is more complicated than that, but what interesting thing isn’t?
    6. Betty Boop: Sally Swing, the debut of Betty Boop’s final redesign and the oddly stunted experiment at creating a new Betty for the swing era.

    What most intrigues me is that the Betty Boop pieces are never popular the day they come out. The WordPress statistics are pretty clear about that. The number of page views on days when those are posted is lower than that of the day before or after. But they’re fun to write, and they clearly endure. It probably helps that each links logically to others, so they invite archive-binging. My normal major pieces for the week, where I report what I just read and what silly things it makes me think of, don’t.

    Well. Now the other popular part, listing countries. The United States as ever sent me the most number of page views, at 585. Canada came in second at 34, the United Kingdom third at 27, and Germany fourth at 22.

    A single reader each came from Algeria, Denmark, Finland, Italy, Norway, the Palestinian Territories, Poland, and South Africa. The repeats from March were Finland and Italy; Italy’s on a three-month streak. India was listed as sending me only two readers, which can’t be right, considering how much I’ve been doing to publicize it the last couple Statistics Saturdays. The “European Union” was also listed as sending me two readers. I don’t know what this designation means, since countries within the European Union are separately listed.

    I did, finally, have some interesting search terms the past month. Here’s some:

    • dear penelope, i have been so tied up with work during the last week that i have not had a chance to get near a desk to write to you.
    • math comic strip clipart
    • crazy.bolle.com
    • funny pea soup cartoon
    • funny boss yelling at employees for productivity
    • spiderman newspaper boss
    • yard sale statistics
    • corny jokes about the milky way
    • reverberating voice cartoon
    • the king of jazz delbert cobain
    • math jokes on binomial
    • j. wellington wimpy character

    I can understand why some of them would draw people here, but “crazy.bolle.com”? And I confess knowing nothing of Delbert Cobain. The most of what I know about yard sales is that if you are holding one, you should double what you think fair prices on all the things you’re selling, and then cancel the yard sale. You’ll be happier that way.